What the Data tab is answering
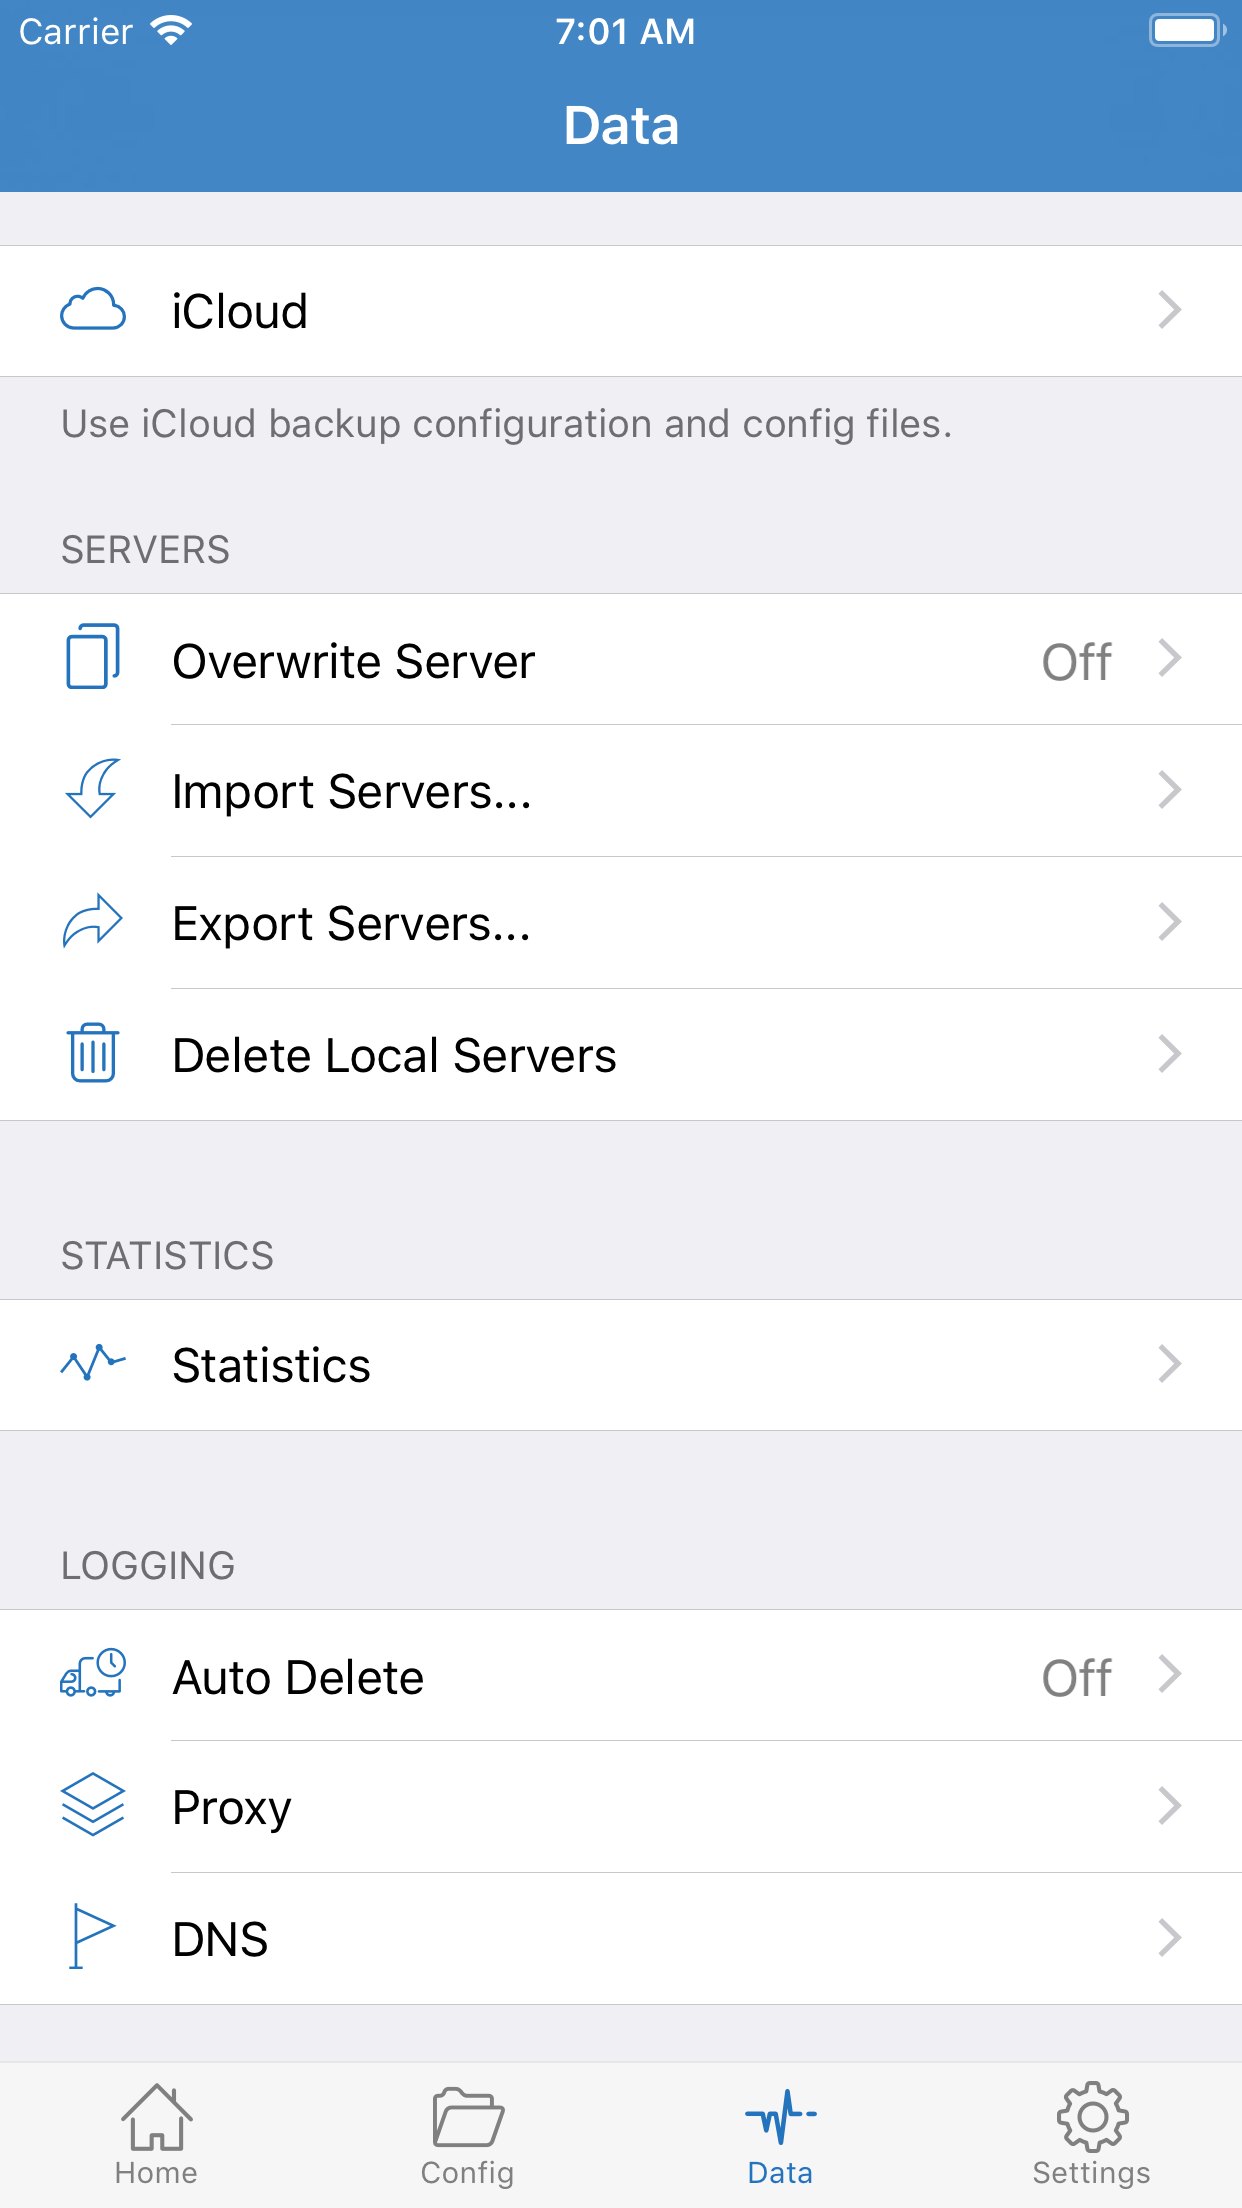
Shadowrocket has a Data tab at the bottom. In the store screenshot that page is iCloud backup, import/export servers, a Statistics entry, and logs — not two big counters. Direct / Proxy totals live under Statistics; Proxy in the log group is the proxy request log. It does not tell you whether speed is “good,” and it does not replace latency tests. It answers a more basic question: is traffic going the way you think it is.
A VPN icon only means the system accepted this VPN configuration and the switch is connected. The icon can be there while every request still goes direct, or never enters this app. Treating the icon as “already on the node” throws off every later judgment.
The method is simple: note the current numbers, open a site or app you believe should be proxied, wait about ten seconds, then look again. Whether the numbers rose as expected is more useful than toggling the switch three times.
What Direct and Proxy each mean
Direct is traffic that skipped the proxy and left on the phone’s own network. A DIRECT rule hit, routing left on Direct, or some system requests that never use this tunnel all land here.
Proxy is traffic sent to the selected node. If you are opening a site that needs to leave the country, and rules or global assigned it PROXY, this number should rise over time.
Both numbers are totals, not live speed. A small rise in a short window still counts as “it is going.” Only a complete freeze needs troubleshooting. Some versions also show connection logs; that is a later step. These two totals are enough to judge the split.
Three common readings
Both stay near 0 for a long time. Almost no requests passed through Shadowrocket. Check: whether the switch is actually connected; whether the VPN configuration prompt appeared and was allowed; whether Settings turned off Wi-Fi or cellular for the app; whether routing is on Direct and nothing countable has happened. If there are no nodes at all, follow empty list after save and Update the subscription. Do not wait on Data.
Only Direct rises; Proxy does not move. Traffic entered the app but never reached a node. Most often a rule marked the hostname DIRECT, or routing is Direct. Compare: switch routing to global (Proxy) and open the same site. If Proxy starts rising on global, the node can take traffic — go fix the rule. If Proxy still does not rise on global, check whether the node works and whether the subscription expired.
Proxy is rising, the target still fails. Requests already left. The problem is more likely the node’s exit, the site itself, or DNS. Try another node rather than staring at Data. Comparison steps: troubleshooting and rule mode vs global.
When local apps get slow, which column to read first
If messaging, banking, or video apps get slow with Shadowrocket on, look at whether Proxy is high. A sustained Proxy climb while routing is global almost always means traffic that should have stayed local was sent through the node. Switch back to rule mode and keep those names on DIRECT. Do not hunt for a “faster” node first. Latency tests compare the hop to the node. They will not fix names sent the wrong way.
If those apps are still slow in rule mode and Proxy is still high, inspect the rule file: whether local domains were written as PROXY, whether FINAL is last, and whether FINAL sends everything to the proxy. Syntax: rule-based routing.
Direct high, local apps fine, only a few remote sites fail: that is normal rule mode. Add that one domain, or compare briefly with global. Do not switch to global as the long-term default.
How to run a useful comparison
- Note the current Direct and Proxy numbers in Data, or reset stats if your version offers it.
- Confirm the switch is on and a node you trust is selected.
- Open only one target (one page or one app), wait about ten seconds, then see which column increased.
- If it is not what you expected, change one variable: routing (rule / global / direct) or the node, not both.
Changing the switch, rules, node, and DNS at once still leaves you unsure which step did anything. Data’s value is splitting “did it leave” from “did the page load.”
How this relates to the switch and permission
The first connect, iOS asks to add a VPN configuration. If you did not allow it, the icon, the switch, and Data will not line up. In Settings, under VPN or the related permission, confirm Shadowrocket is listed and connected.
Low Power Mode, local-network permission, and the cellular toggle can occasionally stop traffic from entering the app, so Data freezes. Check system permission before deleting and re-adding a subscription. If permission is fine, the list has nodes, and Proxy is still 0, go back to routing and rules.
If the client is not installed, buy it on the App Store first. Without the genuine app, Data stats do not exist. Purchase and store-account switching: download guide. Import and connect: tutorial.
Some system requests, OS updates, and traffic that never uses this VPN interface will not appear in Data. So “the phone’s total usage is rising, Data barely moves” is consistent: that traffic never entered Shadowrocket. Conversely, Data rising and cellular usage in Settings rising only means data used this tunnel. It is not a remaining-quota estimate.
Do not use Data to decide whether a subscription expired. After expiry, node names may still be there, and Proxy may still rise (requests left), but the target will not load. Expiry is a question for the provider, or whether Update still returns a valid list. Data only tells you whether the split matches your settings. It does not do billing.
If you read logs, treat Data as an index: use the two totals for direction, then open connection logs to see whether a hostname went DIRECT or PROXY. If you do not use logs, the comparison in this article is enough. Do not reset tiny numbers over and over or you will not see a trend. Pick one target, wait about ten seconds, and avoid constant refresh.